
Palantir Stock Forecast ($PLTR): How Long Until it Hits $35?

Palantir Technologies (PLTR) stock formed a selling pressure from its all-time high of $21.26 per share. The substantial free cash flow generated by the organization possesses the capacity to propel PLTR stock edging closer to its prior peak by more than 21%.
Table of Contents
Palantir Stock Forecast Overview
The potential bullish signal of 21% can be attributed to its adjusted free cash flow (FCF) for the third quarter, which amounted to $141 million. By extrapolating this margin, analysts forecasted the revenue to be $2.66 billion for 2024, with a free cash flow of $665 million. Under an FCF metric of 1.5%, the market capitalization could increase by 21.6% from its current value of $36.47 billion to $44.33 billion.
Even though Palantir does not pay dividends from its FCF now, investors can generate fictitious income by selling OTM puts. To execute this strategy, $1,550 in cash or margin must be secured to potentially purchase 100 shares at $15.50 if the put contract is exercised.
Overall, the company can generate revenue while it awaits the stock to attain its target price, particularly if the free cash flow in the fourth quarter replicates the robustness observed in the third quarter.
Let’s see the PLTR price projection for 2024 from the Palantir Stock technical analysis:
Palantir Stock (PLTR) Formed A RSI Divergence
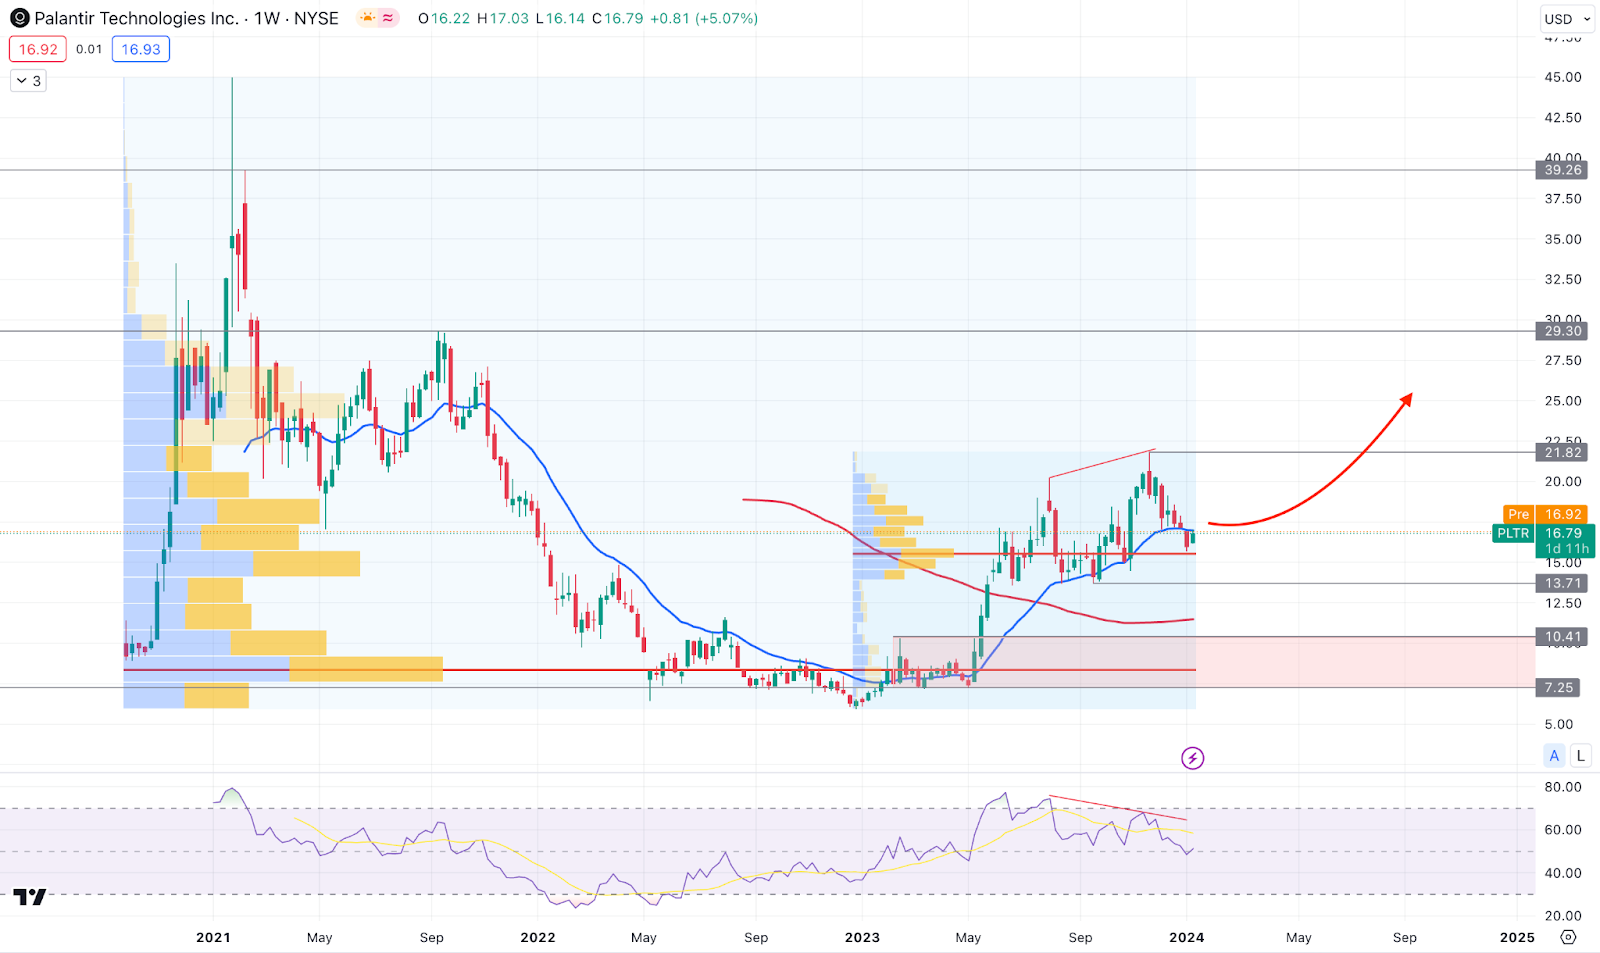
In the weekly chart of PLTR, a solid bottom is visible at the 5.95 level from where a recent recovery came. Moreover, the price went sideways after an impulsive buying pressure, which indicates a re-accumulation in the bullish trend.
In the monthly candlestick pattern, consolidation is seen in the last 7 candles, backed by a strong bullish trend. Moreover, the most recent candle shows a bullish continuation opportunity as it trades sideways after a bullish inside bar formation.
Looking at the volume structure- the most active level since 2021 is at the 8.20 level, within a critical demand zone. Moreover, another high volume level from the 2023 bottom is 15.55, below the near-term dynamic 20-day EMA support. Based on the volume structure, the overall order building is towards the buyers’ side, which could continue the bullish trend.
In the weekly chart, a deep discount is visible as the current price trades below the 20-week EMA level. However, the long-term direction is bullish as the 100-week SMA remains flat below the 20 EMA level.
In the secondary window, the Relative Strength Index (RSI) shows a corrective momentum as the recent reading is at the 50.00 neutral level. Also, a divergence is visible with the price as the RSI failed to make a new high, following the main chart.
Based on the current PLTR outlook, a bull run might resume after eliminating the early short opportunity from the RSI divergence. In that case, a bullish reversal with a stable market above the 20.00 psychological level could be a long opportunity in this stock. Primarily, the 29.30 resistance level could be the first target in 2024 for this stock. Above this level, the next resistance is at the 39.26 level, which might be achieved in 2024-2025.
However, a deeper correction is possible towards the 10.41 to 7.25 area, which might come after moving below the 13.71 level.
See related stock forecasts: $AAPL | $LULU | $RIO | $ARKK | $BRK.B
Palantir Stock (PLTR) Ichimoku Cloud Analysis
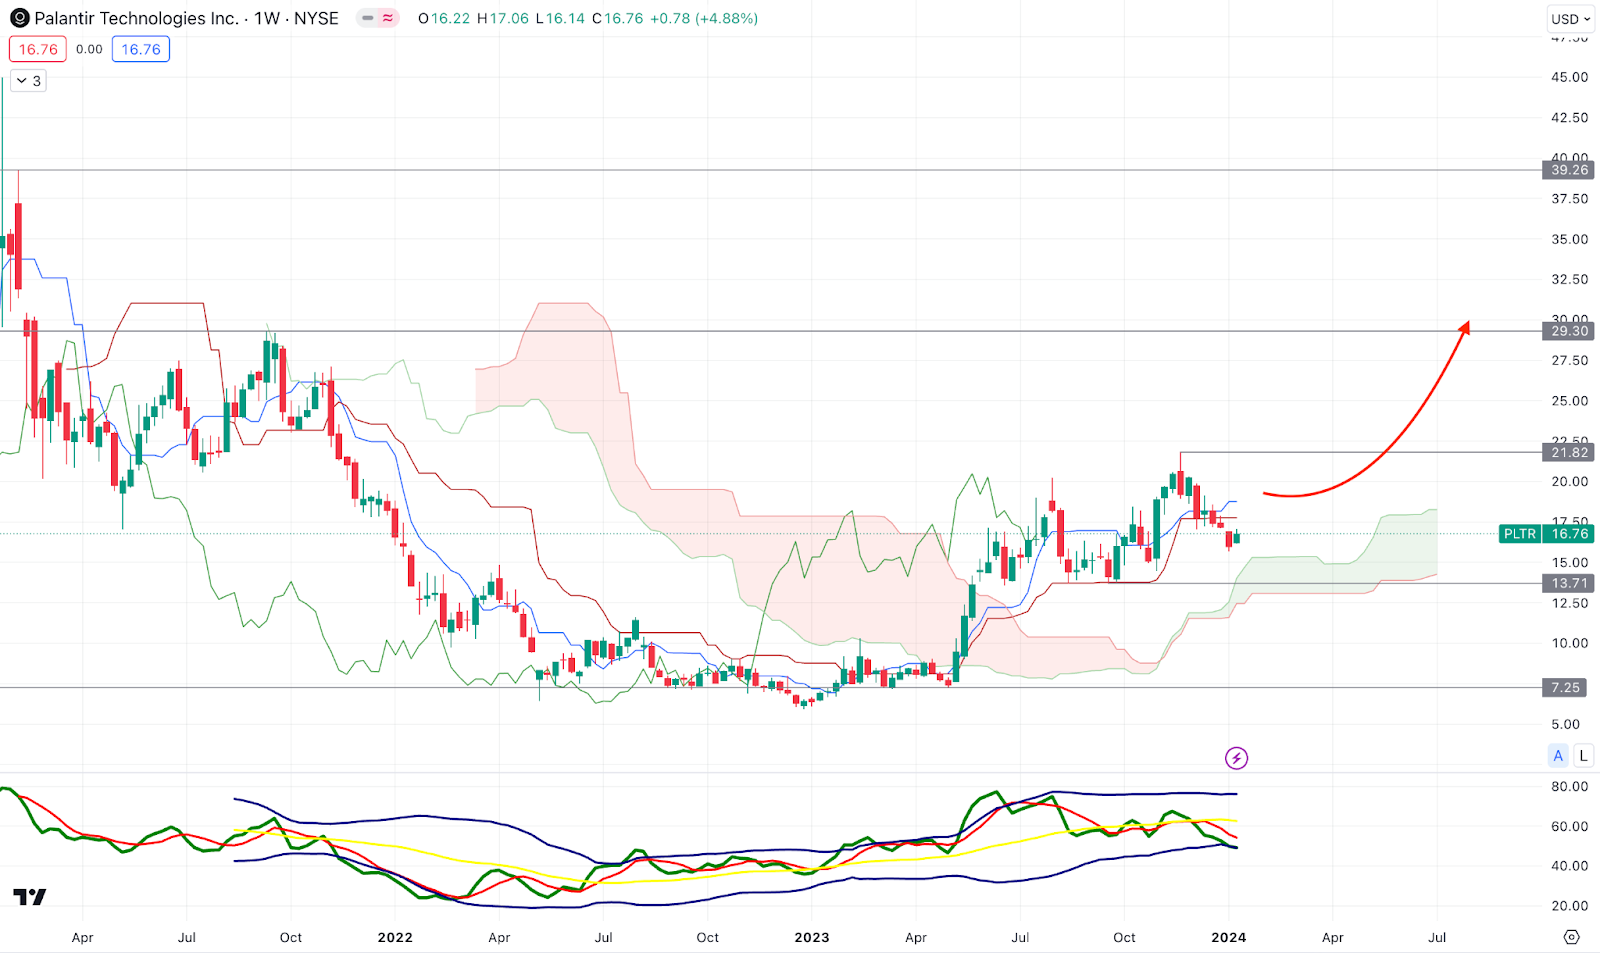
In the weekly chart of PLTR, the ongoing buying momentum is visible as the current price trades above the Ichimoku Kumo Cloud. Moreover, the future cloud remains upward, suggesting a bullish continuation opportunity.
In the Traders Dynamic Indicator, the current reading suggests a downside pressure as the TDI level reached the lower band area.
Based on this outlook, investors might expect a bullish continuation after overcoming the dynamic Kijun Sen level. In that case, the bullish impulsive trend could increase the price towards the 35.00 area.
On the bearish side, a failure to hold the price below the 13.71 support level could lower the price towards the 7.00 area.
Palantir Stock (PLTR) Bulls Could Resume After A Channel Breakout
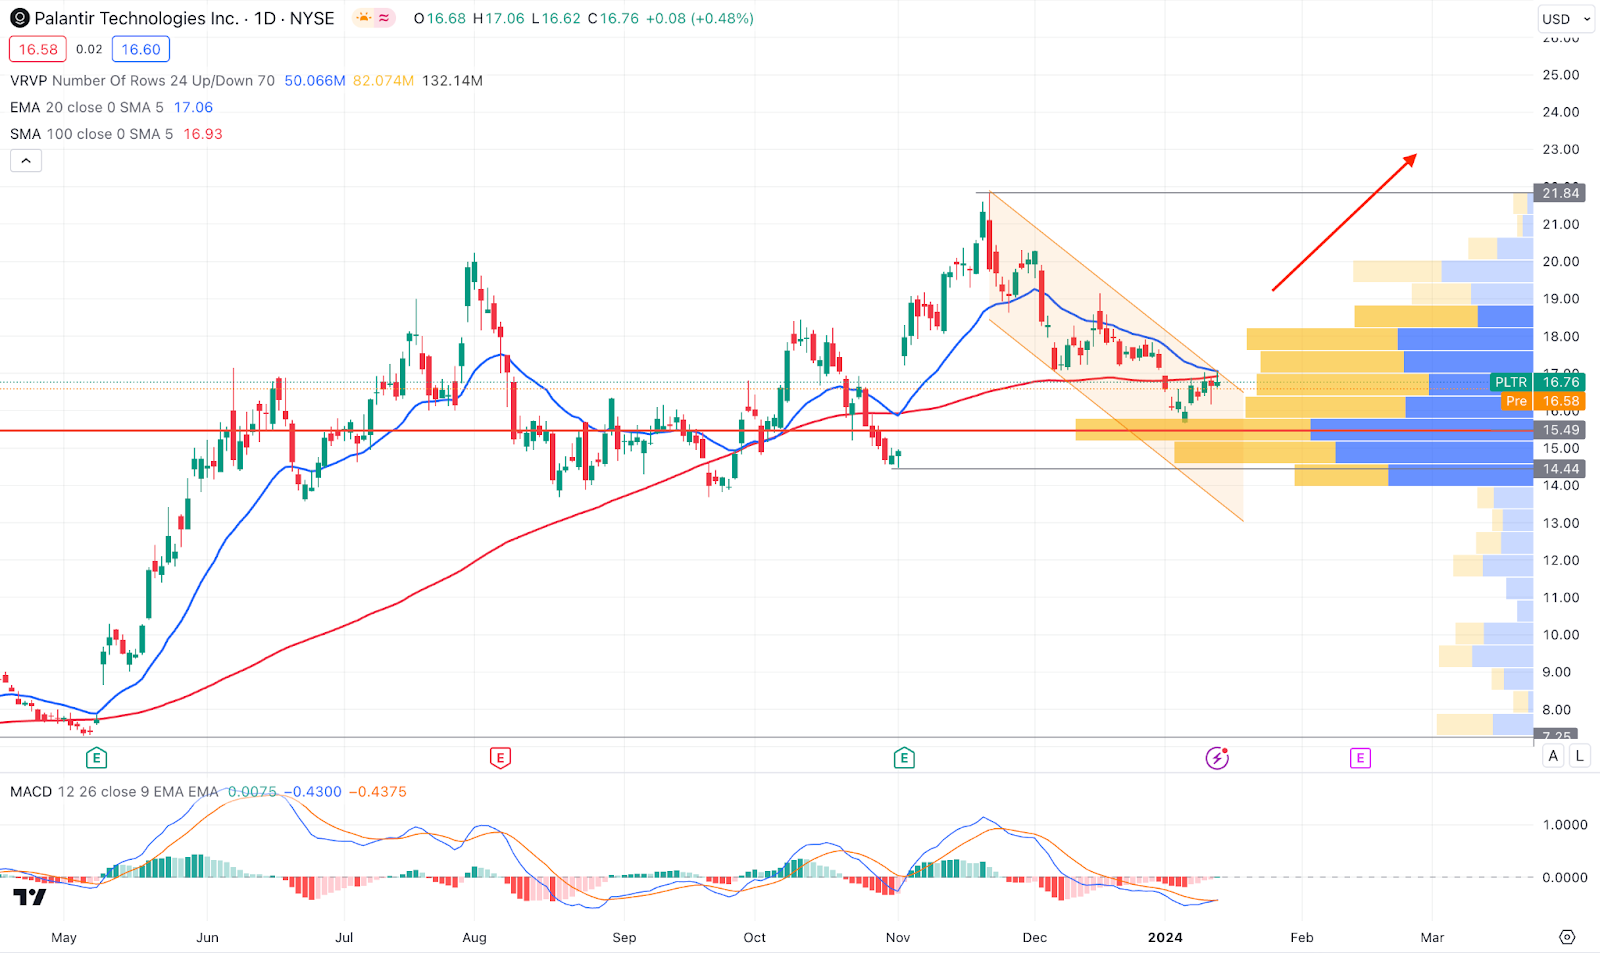
In the daily PLTR chart, the most recent price shows a simple ascending channel formation, which often works as a strong bullish continuation opportunity.
Moreover, the dynamic 20 and 100-day Simple Moving Averages came closer together, which might work as a confluence bullish factor after a breakout.
In the indicator window, the MACD Histogram reached the neutral point, while the signal line formed a bullish crossover from the lower band area
Based on this outline, a bullish trend trading opportunity might come after overcoming the 20 DMA level with a consolidation. On the other hand, a selling pressure below the 14.44 level could lower the price toward the 10.00 area before forming another bullish opportunity.
Is Palantir Stock (PLTR) A Buy?
Based on the current market outlook, Palantis Stock (PLTR) bulls could resume the buying pressure after invalidating the short-term downside opportunity. Investors might find a high probable long opportunity after finding a stable channel breakout form the daily chart.


[…] related stock forecasts for: $PLTR | […]