
Lululemon Stock Forecast ($LULU): Can it Hold Multi-Year Gains and Hit $600 in 2024?

Compared to the previous year, when severe winter conditions impeded last-minute purchasing, the United States and Canada experienced unusually mild conditions preceding Christmas. Like the previous year, they observed substantial store traffic before and after the holiday season.
Table of Contents
Lululemon adhered to its customary practice of commencing reductions after the holiday season, reflecting an estimated 30% surge in in-store markdowns compared to the previous year. Moreover, online markdowns increased by 25%.
The complete picture of this prosperous holiday season will become apparent in the spring when the financial report for the fourth quarter is released, thereby disclosing the magnitude of its achievements.
In the broader outlook, the gross profit margin remains above the 50% level for the last 6 years, with a stable EBITDA ratio. The current ratio at 2.32 suggests a stable day-to-day business, while the long-term debt structure is potent for raising more finances.
See also: Rio Tinto Stock Forecast
Let’s see the future price of LULU based on technical analysis:
Lululemon Stock Forecast ($LULU) Technical Analysis
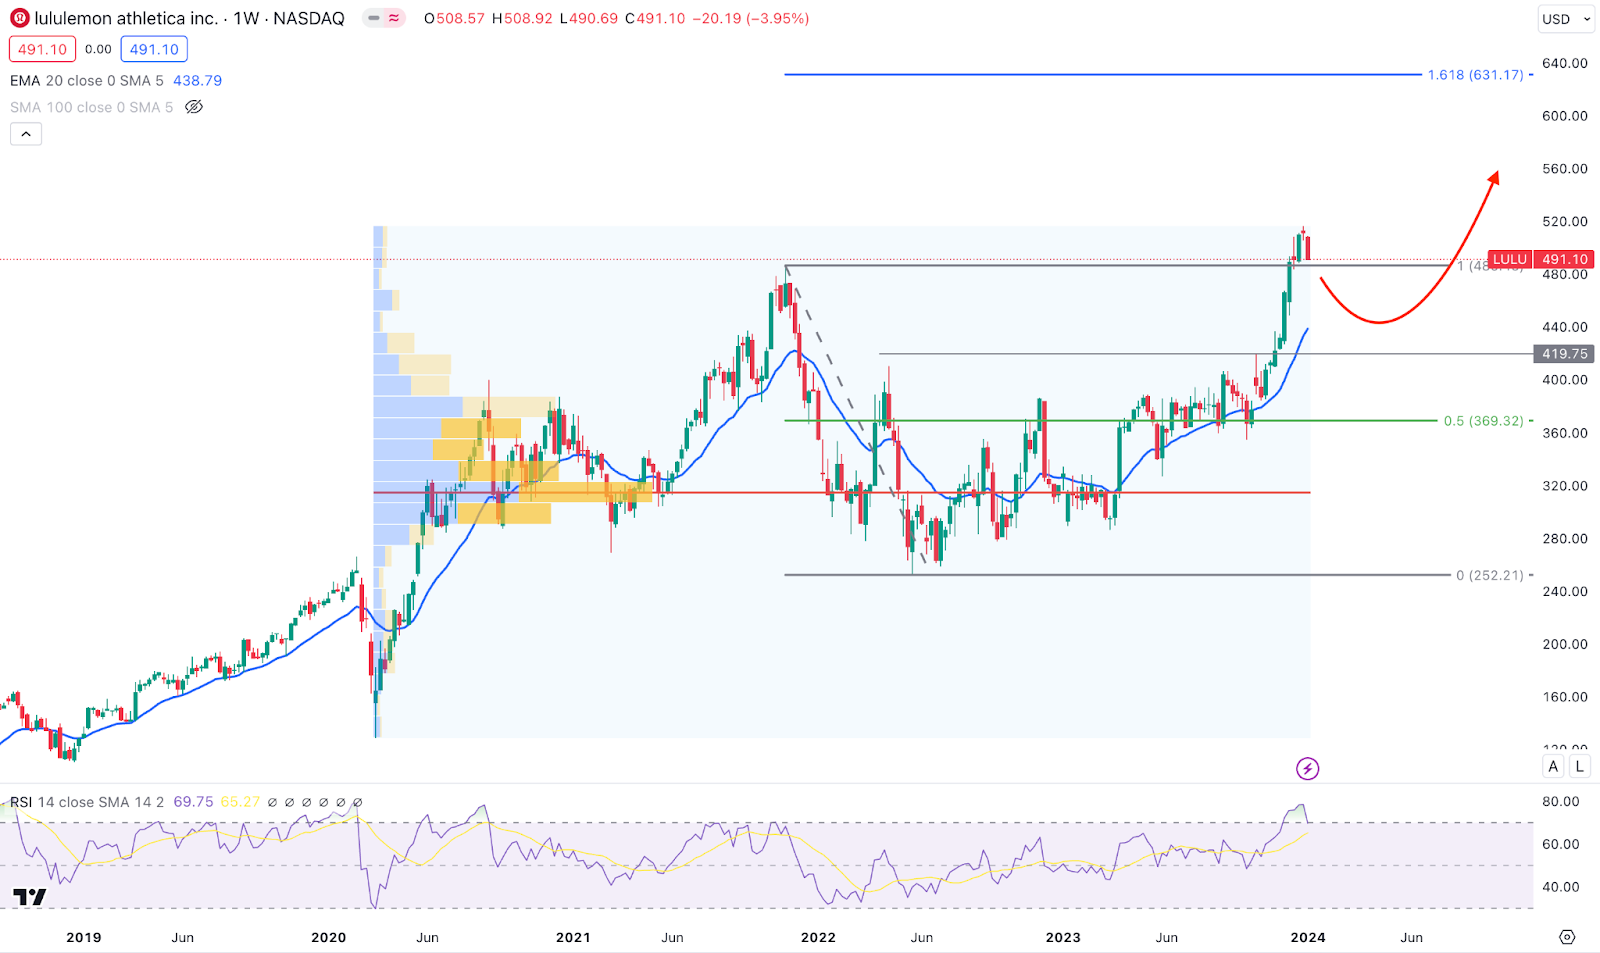
In the weekly chart of LULU, the overall market momentum is bullish, supported by a rising Moving Average and a bullish Relative Strength Index (RSI).
Primarily it is an ongoing bullish trend and investors might expect a trend continuation after a considerable downside correction.
According to the visible range high volume level, the broader market direction looks bullish as the most recent high volume level is at the bottom area.
However, the gap between the current price and the high volume area has extended, which could result in a downside correction. Another bearish factor in this instrument is the bullish correction above the 486.12 level.
In general, an immediate downside pressure below this crucial level could indicate a buy-side liquidity sweep at any time.
Although the dynamic 20-week EMA is below the current price, with an upward slope, it has more room to form a downside correction as a mean reversion. Moreover, the RSI is overbought, indicating extreme buying pressure in the main chart.
Based on the weekly market outlook of LULU, the ongoing buying pressure could extend toward the 630.16 level, which is a 161.8% Fibonacci Extension level from the current swing.
However, a decent downside correction is pending, where a daily candle below the 486.00 level could initiate a bearish correction toward the 410.39 to 369.05 area. A bearish daily candle below the 369.00 level could consider the current structure as bearish, targeting the 252.27 level.
See related: Which Crypto Will Explode in 2024?
Lululemon Stock Forecast ($LULU) Ichimoku Cloud Analysis

According to the Ichimoku Cloud analysis, LULU trades higher from the Cloud support, suggesting ongoing buying pressure. Moreover, the recent price trades above the dynamic Kijun Sen level, indicating a bullish confluence factor for this stock.
In the future cloud, the dynamic Tenkan Sen and Kijun Sen show bullish traction, suggesting ongoing buying pressure in the market.
In the secondary indicator, the ADX represents the running trend, which has already made a peak. In that case, a downside slope in the ADX level could indicate a corrective trend.
Based on this outlook, a downside correction is pending as the daily candle closed below the dynamic Tenkan Sen level. Primarily, this bearish correction could extend toward the dynamic Kijun Sen level before forming a bullish reversal.
On the other hand, a prolonged downside momentum with consolidation below the Kijun Sen support could lower the price to the 410.35 event level.
Lululemon Stock ($LULU) Price Action Analysis
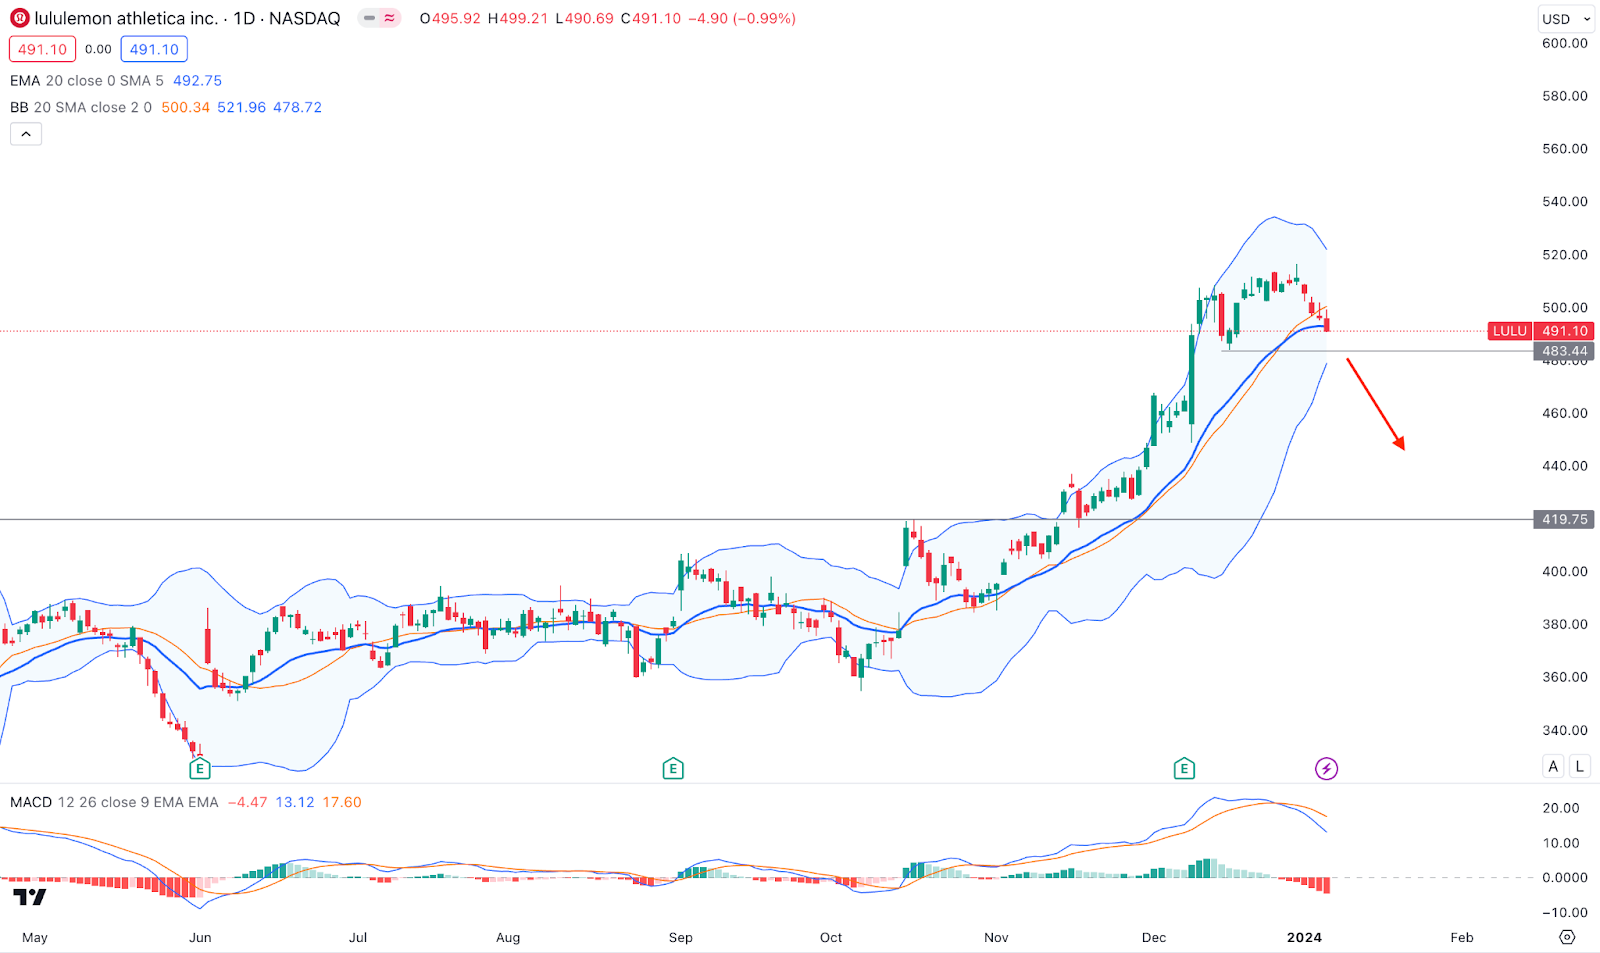
In the daily chart of Lululemon Stock (LULU), the ongoing buying pressure has peaked as a sideways market is visible above the dynamic 20-day EMA level. Moreover, the current price trades below the mid-Bollinger Bands, which suggests a minor bearish correction.
On the selling side, a bearish daily close below the 419.75 level could initiate a strong bearish trend, aiming for the 320.00 area. However, a bullish rebound from the lower Bollinger Bands level, where a V-shape recovery above the 483.77 static support.
Is Lululemon Stock ($LULU) A Buy?
As the long-term outlook of this stock is bullish, any minor downside correction could attract bulls from the discounted price. As the beginning of 2024 comes from an all-time high area, a significant selling pressure might come as a profit taking. Now, investors should closely monitor how the price retraces in 2024 before joining the bull run with the target of a new all-time high within 20-30 months.


[…] See related stock forecasts: $AAPL | $LULU | $RIO | $ARKK | $BRK.B […]